While going over the some forums related to machine learning, I stumbled upon kaggle.com which has a machine learning competition with the titanic dataset, called Titanic: Machine Learning from Disaster. Basically, you are given a list of Titanic passengers, which states whether each passenger survived the tragedy or not, the class which they travelled in, their age, gender, and many other related attributes. Then you are given a list of passengers with all the above attributes, without mentioning whether they survived or not, and your task is to predict which of the passengers survived. The moment I saw this competition I was hooked up! It was quite interesting to play with the given dataset.
It is a very surreal feeling that you get, when you scroll through the list of names, to see that some of these people were lucky enough to survive and some were not so lucky. (And it is almost like being God, trying to predict the fate of the rest of the passengers). But looking closely at the data set, we can see that there are many factors which decided the fate of these passengers, apart from their luck.
Passenger Features
The intention of this post is to try to look at the given training data set to identify its patterns. The following is the list of parameters available in the dataset:
survival        Survival
                (0 = No; 1 = Yes)
pclass          Passenger Class
                (1 = 1st; 2 = 2nd; 3 = 3rd)
name            Name
sex             Sex
age             Age
sibsp           Number of Siblings/Spouses Aboard
parch           Number of Parents/Children Aboard
ticket          Ticket Number
fare            Passenger Fare
cabin           Cabin
embarked        Port of Embarkation
                (C = Cherbourg; Q = Queenstown; S = Southampton)
After downloading the dataset, you can open it in excel. Before starting to work with machine learning algorithms, you can play around the data and identify a lot of useful features by creating a pivot table, or by using the “format as table” option and conditional formatting.
The given data set contains 891 records, out of this, 342 passengers survived.
Gender
When looking at the statistics we see that about 74% of the females survived, whereas only 19% of the males survived. This is a strong indication that if the passenger was a female, she had a better chance of surviving than a male. This fact is expected, because women and children were given priority when passengers were evacuated to the rescue boats.

Passenger Class
Titanic passengers were belonging to three classes, class 1, 2 and 3. Looking at the data we see that about 63% from class 1 were survived, and only 25% from class 3 survived.
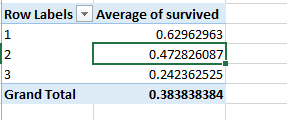
The following chart, taken from here gives a clear picture of how gender, age and passenger class determined the survival of passengers.
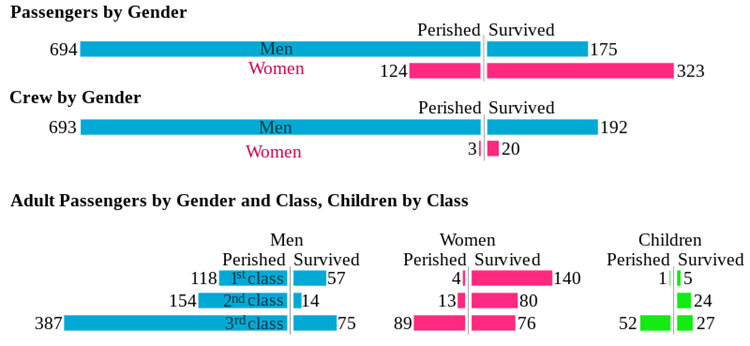
While the given passenger attributes can be directly used as features for machine learning algorithms, there are a couple of other features that we can compute from the given data.
Travelling alone vs. with family
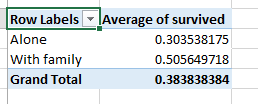
If we add the number of parents and children and siblings parameters, we can decide whether the particular individual travelled with his/her family or not. We can see that only 30% of the people who travelled alone survived.
Family survived vs. died
If you closely look at the data, you can see that most of the families tend to survive or perish together. We can assume that the people with the same last name are of the same family. We can identify 133 such families in the data set.
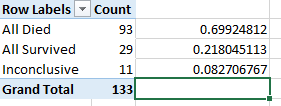
Out of these, 93 families died together, and 29 families survived together. There were 11 families where some members died and others survived. Therefore 122 out of 133 (91.7%) of the families either died or survived together. Therefore when we consider a passenger in the training set who travelled with his family, there is a very good chance that he shared the same fate as his/her family members.
Many other interesting features can be computed with the existing data, which will increase the accuracy of your classifiers. Excel and Matlab can be used to quickly visualize the relationships among features. Put yourself in the shoes of a Titanic passenger, and try to think which factors would help you in surviving the tragedy and observe the existing data to test your hypothesis.
thanks dear.it helps me on my next research project